Comparing Weather Files
Comparing Weather Files
Breathing Buildings use weather files provided by the Chartered Institution of Building Services Engineers (CIBSE) in order to model overheating in buildings throughout the year. CIBSE provides two types of weather file, for 14 locations across the UK:
-The Test Reference Year (TRY) is intended to represent a ‘typical’ weather year and has been assembled using average months from a database of historical weather data over a period of 30 years.
-The Design Summer Year (DSY) is designed to represent a year with a hot summer. Therefore, we would expect the DSY to be a harsher model for buildings, particularly in terms of overheating regulations.
When assessing potential overheating in buildings, it is typical to consider the summer period, May-September, as these are generally the hottest months of the year.
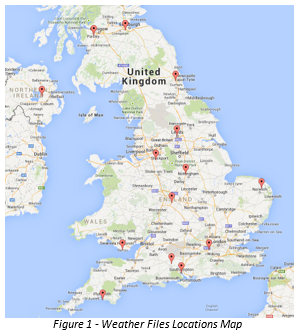
Figure 1 shows a map of the UK with the weather file locations indicated. The wide spread of locations across the UK indicates that significant variations in temperature would be expected between the different weather files. The 2006 CIBSE weather files for the locations indicated on the map are analysed below.
Generally, Breathing Buildings’ hybrid ventilation systems are designed to operate in what we term ‘Winter Mixing Mode’ whenever the external temperature is below 17°C. This setpoint is based on years of experience about what temperature people perceive as a cold draught. Above 17°C, our units operate in ‘Summer mode’, ventilating the room to prevent overheating.
Figure 2 shows the number of hours our hybrid units would be in Summer Mode between May and September in each of the 14 locations, based on the 2006 weather files. Data for both the DSY and TRY files is displayed.
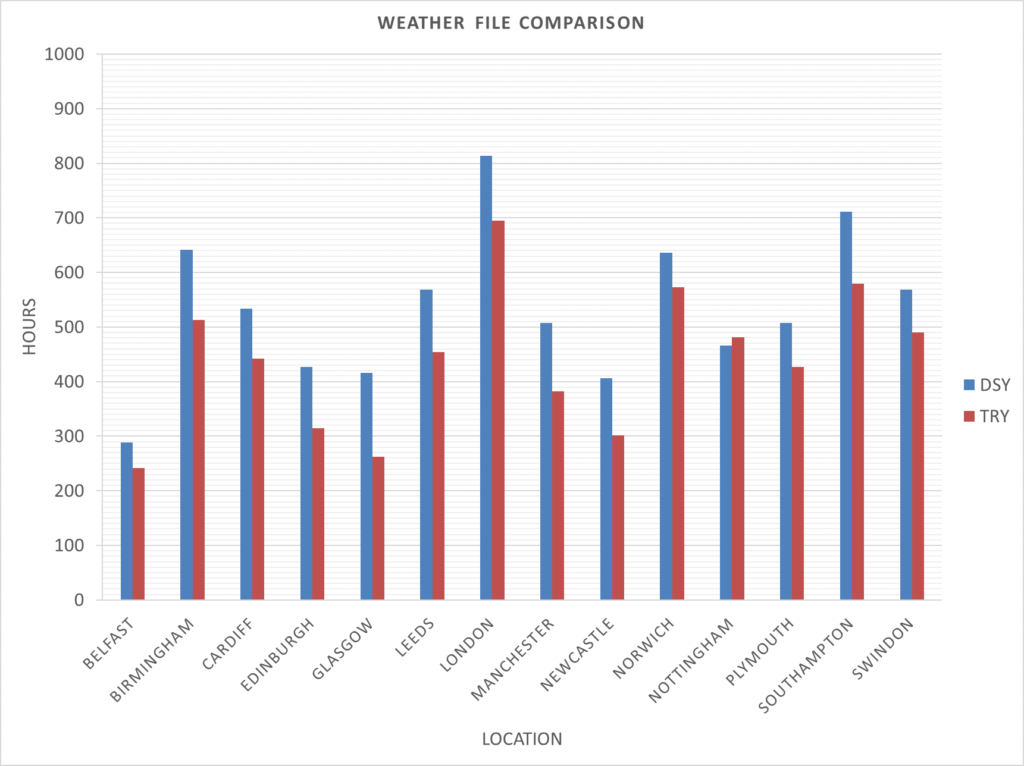
Figure 2 – Hours in Summer Mode (above 17°C)
For both the DSY and TRY files, it can be seen that London has more hours above 17°C than the other locations. This is significant because it means overheating criteria will be harder to pass for buildings located in the London area.
The following analysis examined average, maximum and minimum temperatures during the occupied day of the summer months (May – September), taken to be 9am-4pm.
Figure 3 shows the average temperature for each location in occupied hours, with the top of the error bar showing the maximum temperature and the bottom of the error bar showing the minimum temperature.
With an average of 20.2°C, a maximum of 33.1°C and minimum daytime temperature of 10.8°C for the DSY file, the warm climate in London is further demonstrated in Figure 3. The London TRY weather file also displays similarly warm temperatures. In addition to its South-East location, London is the largest and most densely populated city in the UK. It is, therefore, expected to be largely affected by the ‘urban heat island effect’ (UHI). The UHI effect suggests that large cities, with an abundance of heat production, densely packed buildings and busy roads, tend to retain elevated temperatures from day-to-day, not demonstrating the same overnight drop in temperatures which are a feature of less built up areas.
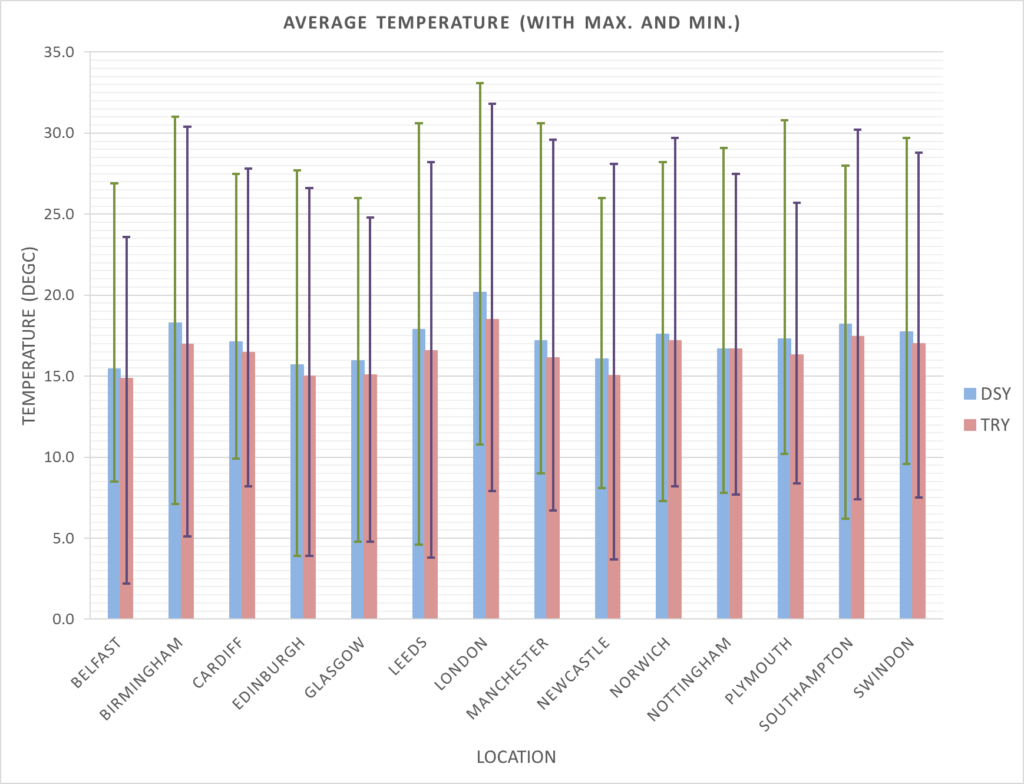
Figure 3 – Average Temperature (°C) with Maximums and Minimums
Of the TRY files, it is clear that Belfast has the coolest summer, with the fewest hours above 17°C, the lowest average temperature, lowest maximum temperature and lowest minimum temperature. However, it is not clear which DSY file has the coolest summer. The Belfast DSY has the fewest hours above 17°C and the lowest average temperature, but its maximum temperature is 26.9°C, which is 0.9°C warmer than Glasgow and Newcastle. The minimum temperature in the Belfast DSY is 8.5°C which is 4.6°C warmer than the minimum for Edinburgh. This suggests the Belfast DSY summer is a reasonably consistent weather file, with no major heat spell and no major cold spell during the summer. This consistently mild climate in Belfast can be explained by its proximity to the sea. The sea absorbs a large amount of heat from the sun, keeping the air temperature relatively cool and consistent during the summer.
Comparing London and Belfast
As London DSY is the warmest of the 14 weather file locations, and Belfast DSY is consistently one of the coolest, it is interesting to do a comparison of these two. Figure 4 shows the average monthly temperatures for London, while Figure 5 shows the average monthly temperatures for Belfast.
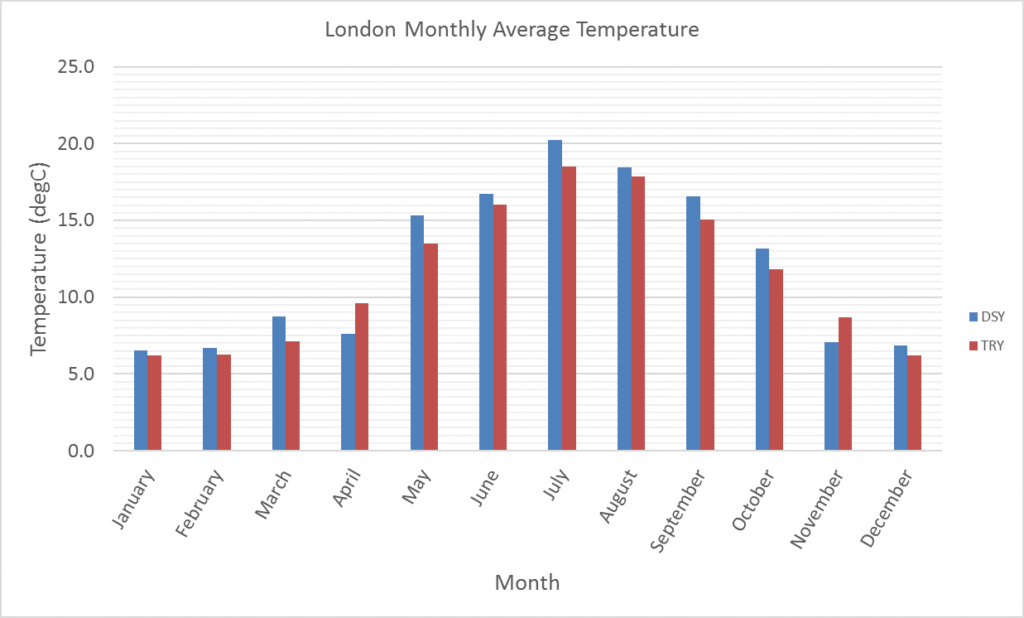
Figure 4 – London Monthly Average
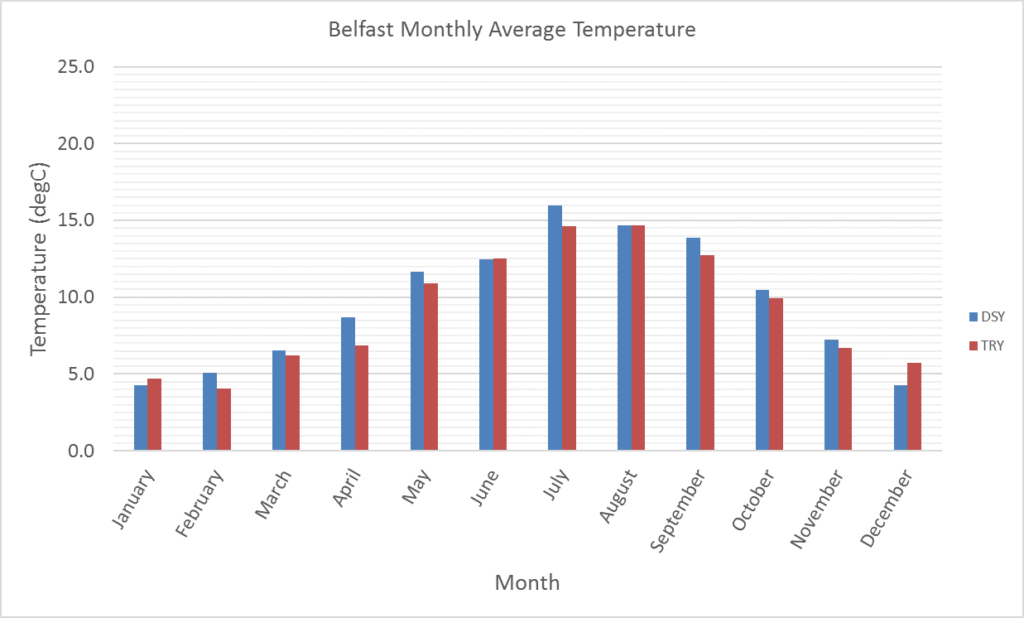
Figure 5 – Belfast Monthly Average
From a brief glance at Figures 4 and 5 it is obvious that the London is in general warmer than Belfast. Looking more closely at the DSY data, in April the average Belfast DSY temperature is 1.1°C hotter than that of London, and in November the average Belfast DSY temperature is 0.1°C hotter than that of London DSY. in the summer months (May – September) the average monthly temperature for London DSY is on average 3.7°C hotter than that of Belfast. However, in winter (October through to April), excluding the anomalies of April and November, the average monthly temperature for London DSY is on average 2.3°C hotter than that of Belfast DSY. The range of average monthly temperature for London DSY is 14.0°C and for Belfast DSY is 11.9°C. These trends all suggest that London DSY has a hot summer, with cold spells in April and November. Whereas, Belfast is comparatively mild all year round, with a reasonably cold winter, but no significantly long heat event in the summer months.
Although the graphs analysed above show interesting trends for the weather file data which give Breathing Buildings an idea of how difficult it is to pass overheating criteria in different locations, it is not clear how this data affects Breathing Buildings units without further analysis.
May to September are typically the hottest months of the year, when overheating is most likely, and buildings such as offices and schools are occupied between 9am and 5pm. The below analysis, therefore, focuses on the summer period and the occupied day. Figure 6 shows the number of hours above 17°C and below 17°C for the London DSY weather file, while Figure 7 shows the same but for the Belfast DSY weather file. As mentioned earlier, 17°C is a significant temperature to Breathing Buildings, as it is a key set point for our units. When the external temperature is below 17°C our units run in Winter Mixing Mode, and when the external temperature is above 17°C our units operate in Summer Mode.
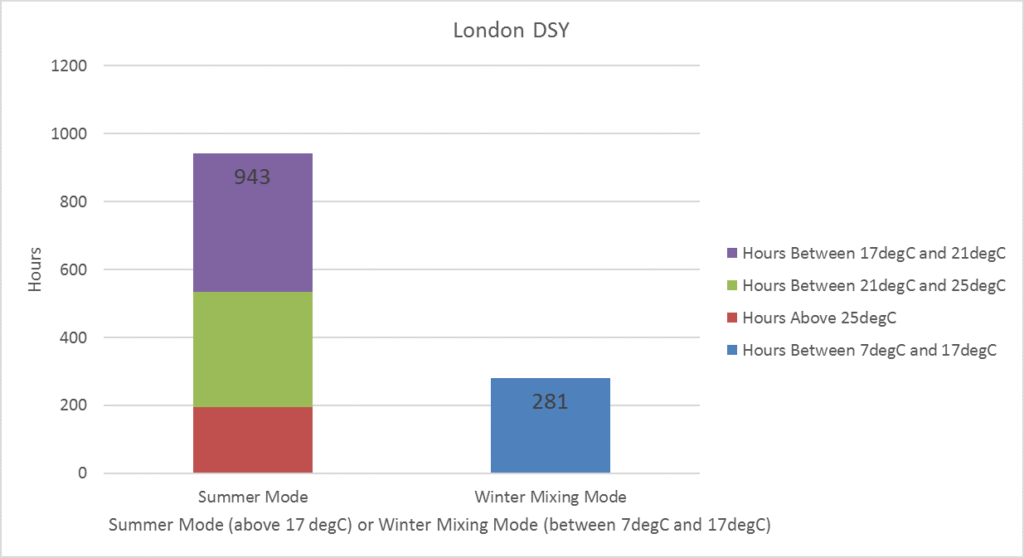
Figure 6 – London DSY Summer Mode and Winter Mode
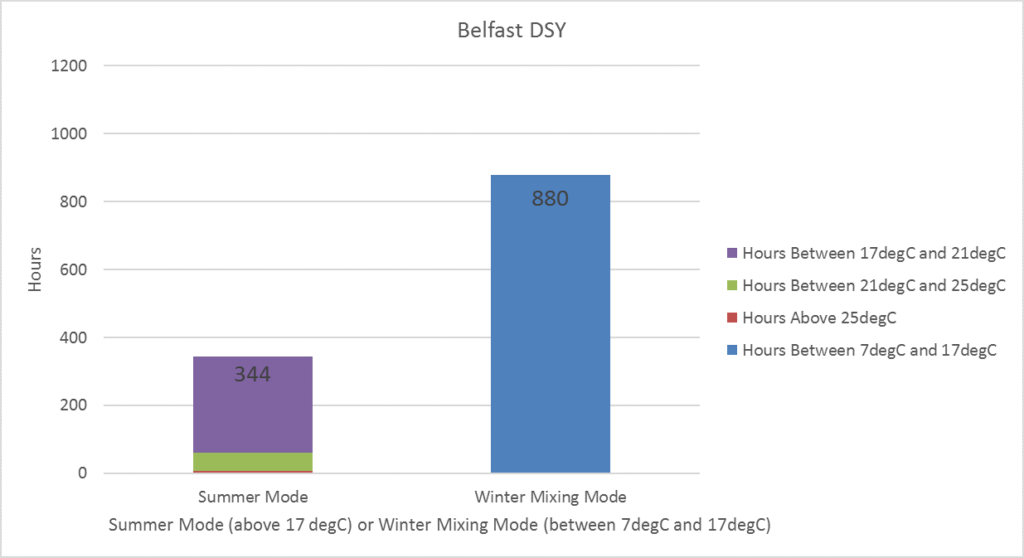
Figure 7 – Belfast DSY Summer Mode and Winter Mode
A key thing to observe from Figures 6 and 7 is that the London DSY file has more hours above 17°C than below 17°C, meaning our units would be expected to be in Summer Mode for more hours than they are in Winter Mixing Mode during the summer months. On the other hand, the Belfast DSY file has fewer hours above 17°C than below 17°C, meaning our units would be expected to be in Winter Mixing Mode for more hours than they are in Summer Mode, even during the ‘summer’ months. Looking back at Figures 4 and 5, it can been seen that during the summer months, the monthly average temperatures for the London DSY file are all close to or above 17°C, whereas the monthly average temperatures for the Belfast DSY file are all below 17°C. Therefore, the results shown in Figures 6 and 7 fall in line with what would be expected.
Summary
Overall, there is a large temperature variation between weather files for locations across the UK. At one extreme, the London weather files display a consistently warm climate, with the highest maximum temperatures and highest average temperature across the whole year. At the other extreme, the Belfast weather files display a consistently cold climate, with some of the lowest maximum temperatures and the lowest average temperatures across the whole year of the weather files. These high temperatures in London are due to the ‘urban heat island’ effect which is caused by the extra heat produced and stored in highly built up areas. The colder temperatures in Belfast are due to its proximity to the sea. The sea is a large thermal mass which absorbs a lot of heat, keeping the climate in the area consistently mild.